Building a Persistent Azure Operations Dashboard (AZQR + App Service + Storage)
2025-12-17 · ~34 min read
Microsoft's Azure Quick Review (AZQR) consolidates Advisor, Defender for Cloud, Policy, and Cost Management into one dashboard - but only runs locally. Here's how to host it in Azure App Service for 24/7 team access, scheduled scans, and historical tracking. Complete with Dockerfile, deployment scripts, and Entra ID authentication. Part 3 of the Azure Operations Platform series.
Building a Persistent Azure Operations Dashboard (AZQR + App Service + Storage)
Short Answer
Azure Quick Review (AZQR) consolidates Azure Advisor, Defender for Cloud, Azure Policy, and Cost Management into a single web dashboard, but runs only as a local process on localhost:8080. Hosting AZQR in Azure App Service with Azure Storage backend creates a persistent operations dashboard accessible 24/7 at a custom URL with Entra ID authentication. Scheduled scans via cron or Logic Apps generate daily/weekly compliance reports stored as Excel files in blob storage for historical tracking. Total cost: $15-30/month for B1 App Service + storage, providing complete Azure operations visibility for entire teams without third-party tools.
Series Context: Building the Azure Operations Platform
This is Part 3 of the Azure Operations Platform series:
- Part 1: Azure Tags for Operational Intelligence - The data layer (tags enable 30-second KQL queries)
- Part 2: Logic App Certificate Monitoring - The automation layer (continuous monitoring)
- Part 3: Building a Persistent AZQR Dashboard - The visualization layer (you are here)
- Part 4: Complete Platform Integration - How all three layers work together (coming soon)
Why AZQR's local dashboard isn't enough
Microsoft built Azure Quick Review (AZQR) as a CLI tool that consolidates operational data from multiple sources:
- Azure Advisor (Well-Architected Framework recommendations)
- Defender for Cloud (security posture and compliance)
- Azure Policy (governance and non-compliant resources)
- Cost Management (spend analysis and optimization)
- Resource inventory (complete infrastructure catalog)
The problem: AZQR's dashboard only runs locally.
The local workflow:
# Scan your environment
azqr scan

# Launch dashboard
azqr show --file azqr-2025-12-17.xlsx

# Dashboard opens at http://localhost:8080
What this gives you:
- Complete operations dashboard
- All Azure compliance data in one place
- Better than checking six different portals
What this doesn't give you:
- ❌ Dashboard dies when you close terminal
- ❌ Only accessible on your machine
- ❌ Team can't access it
- ❌ No scheduled scans (manual only)
- ❌ No historical tracking
- ❌ Can't share URL with executives
What happens when you need persistent access
Real scenario from our environment:
Security team: "What's our current Defender for Cloud compliance score?"
Me: "Let me run AZQR scan... okay, launching dashboard... here's the link: localhost:8080"
Security team: "Can you send me that link?"
Me: "It's on my laptop. I'll screenshot it."
Security team: "Can we check this daily?"
Me: "I'd have to run it manually each time and share my screen."
This doesn't scale.
What we needed:
- Persistent URL anyone can access
- Always-on dashboard (24/7 availability)
- Scheduled scans (daily at 6 AM)
- Historical reports (track progress over time)
- Team access with authentication
Traditional vs Persistent: Two approaches to compliance
Traditional AZQR workflow:
Run assessment → Generate point-in-time snapshot
Download report → Excel file on your laptop
Review findings → Manual analysis in spreadsheet
Fix issues → Track remediation separately
Repeat cycle → 3-6 months later (if remembered)
Result: Compliance is a periodic event, not an operational state
Persistent dashboard workflow:
Continuous ingestion → Automated daily scans
Trend visibility → Historical tracking over months
Ownership clarity → Team access with authentication
Operational relevance → Dashboard integrated into daily workflows
Result: Compliance becomes operational visibility, not quarterly reporting
The fundamental difference:
Traditional AZQR treats compliance as:
- A project (start, report, finish)
- A document (Excel in email)
- A snapshot (point-in-time)
- An audit requirement (external driver)
Persistent dashboard treats compliance as:
- A system (continuous operation)
- A signal (actionable data)
- A trend (directional movement)
- An operational input (internal driver)
This shift—from report to system—is why persistence matters.
The solution: Host AZQR in Azure App Service.
The architecture: AZQR in Azure
Components:
1. Azure App Service (Linux)
- Runs AZQR dashboard in Docker container
- Always accessible at custom URL
- Handles multiple concurrent users
- Scales horizontally if needed
2. Azure Storage Account
- Blob container for Excel reports
- Historical snapshots (daily/weekly/monthly)
- Retention policy (12 months)
- Mounted to App Service via Azure Files
3. Scheduled Scans
- Option A: Cron inside container (simple)
- Option B: Logic App webhook (enterprise)
- Generates new report daily/weekly
4. Entra ID Authentication
- SSO for team access
- Role-based access control
- No password management
- Conditional access policies
5. Application Insights (optional)
- Dashboard usage metrics
- Performance monitoring
- Error tracking
Who should build a persistent AZQR dashboard?
This approach matters if you:
- Manage multiple Azure subscriptions (10+ subscriptions, consolidated visibility needed)
- Operate in regulated environments (financial services, healthcare, government)
- Need leadership-level visibility (executives, auditors, compliance teams)
- Support distributed teams (remote admins, multiple locations, 24/7 operations)
- Track security posture over time (quarterly trend analysis, board reporting)
You probably don't need this if:
- Small environment (<20 resources)
- Single admin managing everything
- Ad-hoc compliance checks sufficient
- Already using enterprise tools (Prisma Cloud, Wiz, etc.)
The sweet spot: Organizations large enough to need systematic compliance tracking, but not so large they've already invested in expensive third-party platforms.
That's 70% of Azure customers. Microsoft expects you to check six portals manually. We're building the dashboard they should provide.
What AZQR actually scans
Before we build the infrastructure, understand what AZQR provides.
Azure Advisor recommendations:
Five pillars of Well-Architected Framework:
- Reliability (high availability, disaster recovery)
- Security (encryption, network security)
- Cost Optimization (underutilized resources, reservations)
- Operational Excellence (monitoring, automation)
- Performance Efficiency (scaling, caching)
Example findings:
- App Service: Minimum instance count should be 2 (scalability)
- Front Door: Enable diagnostic settings (monitoring)
- Storage: Disable shared key access (security)
Defender for Cloud security posture:
Security plans enabled/disabled:
- Defender for Servers (Plan 1 vs Plan 2)
- Defender for Storage (per-transaction pricing)
- Defender for Containers (Kubernetes security)
- Defender for Databases (SQL threat detection)
Security recommendations:
- Virtual machines should encrypt temp disks
- Storage accounts should use private endpoints
- Key vaults should enable soft delete
Azure Policy compliance:
Policy assignments:
- Microsoft Security Benchmark (foundational CSPM)
- Custom policy initiatives
- Resource-specific policies
Non-compliant resources:
- VMs without required tags
- Storage accounts allowing public access
- Network security groups with permissive rules
Cost analysis:
Spend breakdown:
- Cost by service (VM, Storage, Networking)
- Cost by resource group
- Cost by location
- Underutilized resources
Optimization recommendations:
- Right-size oversized VMs
- Delete unattached disks
- Remove old snapshots
- Purchase reservations
Resource inventory:
Complete catalog:
- All resources by type
- Resource groups and locations
- Tags applied (connects to Part 1)
- Resource IDs for automation
Building the Docker container
Dockerfile for AZQR dashboard:
FROM mcr.microsoft.com/azure-cli:latest

# Install AZQR CLI
RUN curl -sL https://github.com/Azure/azqr/releases/latest/download/azqr-linux-amd64 -o /usr/local/bin/azqr \
    && chmod +x /usr/local/bin/azqr

# Install dependencies
RUN apk add --no-cache bash dcron

# Create directories
RUN mkdir -p /app /reports /logs

# Set working directory
WORKDIR /app

# Copy scan script
COPY scan.sh /app/
RUN chmod +x /app/scan.sh

# Copy cron configuration
COPY crontab /etc/crontabs/root

# Expose port for dashboard
EXPOSE 8080

# Health check
HEALTHCHECK --interval=30s --timeout=3s --start-period=5s --retries=3 \
  CMD wget --no-verbose --tries=1 --spider http://localhost:8080 || exit 1

# Start cron and dashboard
CMD crond && azqr show --file /reports/azqr-latest.xlsx --port 8080 --host 0.0.0.0
The scan script (scan.sh):
#!/bin/bash

# Configuration
REPORT_DIR="/reports"
DATE=$(date +%Y-%m-%d-%H%M)
LATEST_REPORT="$REPORT_DIR/azqr-latest.xlsx"
DATED_REPORT="$REPORT_DIR/azqr-$DATE.xlsx"
LOG_FILE="/logs/scan-$DATE.log"

# Log start
echo "$(date): Starting AZQR scan" >> "$LOG_FILE"

# Authenticate with Azure (using managed identity)
az login --identity >> "$LOG_FILE" 2>&1

# Run AZQR scan
azqr scan --output "$DATED_REPORT" >> "$LOG_FILE" 2>&1

# Check if scan succeeded
if [ $? -eq 0 ]; then
    echo "$(date): Scan completed successfully" >> "$LOG_FILE"

    # Copy to latest (for dashboard)
    cp "$DATED_REPORT" "$LATEST_REPORT"

    # Clean up old reports (keep last 30 days)
    find "$REPORT_DIR" -name "azqr-*.xlsx" -mtime +30 -delete

    echo "$(date): Report updated: $LATEST_REPORT" >> "$LOG_FILE"
else
    echo "$(date): Scan failed with error code $?" >> "$LOG_FILE"
fi

# Log completion
echo "$(date): Scan process completed" >> "$LOG_FILE"
Cron schedule (crontab):
# Run AZQR scan daily at 6:00 AM UTC
0 6 * * * /app/scan.sh

# Alternative schedules:
# Every 12 hours: 0 */12 * * * /app/scan.sh
# Weekly on Monday: 0 6 * * 1 /app/scan.sh
# First day of month: 0 6 1 * * /app/scan.sh
Deploying to Azure App Service
Step 1: Create Azure resources
# Variables
RESOURCE_GROUP="rg-operations"
LOCATION="eastus"
STORAGE_ACCOUNT="stazqrreports"
APP_SERVICE_PLAN="asp-operations"
APP_SERVICE_NAME="azqr-dashboard"
CONTAINER_REGISTRY="acrazqr"

# Create resource group
az group create \
  --name $RESOURCE_GROUP \
  --location $LOCATION

# Create storage account for reports
az storage account create \
  --name $STORAGE_ACCOUNT \
  --resource-group $RESOURCE_GROUP \
  --location $LOCATION \
  --sku Standard_LRS \
  --kind StorageV2

# Create blob container
az storage container create \
  --name reports \
  --account-name $STORAGE_ACCOUNT \
  --auth-mode login

# Create Azure Container Registry
az acr create \
  --resource-group $RESOURCE_GROUP \
  --name $CONTAINER_REGISTRY \
  --sku Basic

# Create App Service Plan (Linux)
az appservice plan create \
  --name $APP_SERVICE_PLAN \
  --resource-group $RESOURCE_GROUP \
  --is-linux \
  --sku B1
Step 2: Build and push container
# Login to ACR
az acr login --name $CONTAINER_REGISTRY

# Build container
docker build -t azqr-dashboard:latest .

# Tag for ACR
docker tag azqr-dashboard:latest $CONTAINER_REGISTRY.azurecr.io/azqr-dashboard:latest

# Push to ACR
docker push $CONTAINER_REGISTRY.azurecr.io/azqr-dashboard:latest
Step 3: Create App Service with managed identity
# Create App Service
az webapp create \
  --resource-group $RESOURCE_GROUP \
  --plan $APP_SERVICE_PLAN \
  --name $APP_SERVICE_NAME \
  --deployment-container-image-name $CONTAINER_REGISTRY.azurecr.io/azqr-dashboard:latest

# Enable managed identity
az webapp identity assign \
  --resource-group $RESOURCE_GROUP \
  --name $APP_SERVICE_NAME

# Get managed identity principal ID
IDENTITY_ID=$(az webapp identity show \
  --resource-group $RESOURCE_GROUP \
  --name $APP_SERVICE_NAME \
  --query principalId \
  --output tsv)

# Grant Reader permissions at subscription level
SUBSCRIPTION_ID=$(az account show --query id --output tsv)

az role assignment create \
  --assignee $IDENTITY_ID \
  --role "Reader" \
  --scope "/subscriptions/$SUBSCRIPTION_ID"
Why managed identity matters:
- No credentials in code
- Automatic authentication
- Audit trail in Entra ID
- Follows zero-trust principles
Step 4: Mount Azure Storage
# Get storage account key
STORAGE_KEY=$(az storage account keys list \
  --resource-group $RESOURCE_GROUP \
  --account-name $STORAGE_ACCOUNT \
  --query "[0].value" \
  --output tsv)

# Mount storage to App Service
az webapp config storage-account add \
  --resource-group $RESOURCE_GROUP \
  --name $APP_SERVICE_NAME \
  --custom-id reports \
  --storage-type AzureBlob \
  --account-name $STORAGE_ACCOUNT \
  --share-name reports \
  --access-key $STORAGE_KEY \
  --mount-path /reports
Result: Reports persist in Azure Storage, survive container restarts, accessible for historical analysis
Step 5: Configure App Service settings
# Set container registry authentication
az webapp config container set \
  --resource-group $RESOURCE_GROUP \
  --name $APP_SERVICE_NAME \
  --docker-custom-image-name $CONTAINER_REGISTRY.azurecr.io/azqr-dashboard:latest \
  --docker-registry-server-url https://$CONTAINER_REGISTRY.azurecr.io \
  --docker-registry-server-user $CONTAINER_REGISTRY \
  --docker-registry-server-password $(az acr credential show --name $CONTAINER_REGISTRY --query "passwords[0].value" -o tsv)

# Enable container logging
az webapp log config \
  --resource-group $RESOURCE_GROUP \
  --name $APP_SERVICE_NAME \
  --docker-container-logging filesystem

# Set health check path
az webapp config set \
  --resource-group $RESOURCE_GROUP \
  --name $APP_SERVICE_NAME \
  --health-check-path "/"
Enabling Entra ID authentication
Why authentication matters:
Without authentication:
- Dashboard publicly accessible
- Anyone with URL can view compliance data
- Security risk (exposes vulnerabilities)
- Compliance violation (unauthorized access to audit data)
With Entra ID:
- Only authenticated users access dashboard
- SSO (no separate passwords)
- Conditional access policies
- Audit trail (who accessed when)
Configure authentication:
# Enable Entra ID authentication
az webapp auth update \
  --resource-group $RESOURCE_GROUP \
  --name $APP_SERVICE_NAME \
  --enabled true \
  --action LoginWithAzureActiveDirectory \
  --aad-allowed-token-audiences "https://$APP_SERVICE_NAME.azurewebsites.net"

# Get the authentication settings
az webapp auth show \
  --resource-group $RESOURCE_GROUP \
  --name $APP_SERVICE_NAME
Configure via Azure Portal (alternative):
- Navigate to App Service → Authentication
- Click "Add identity provider"
- Select "Microsoft"
- Choose "Create new app registration"
- Supported account types: "Current tenant - Single tenant"
- Click "Add"
Result: Users must authenticate with corporate credentials before accessing dashboard
Assign access to users/groups:
# Get the app registration
APP_ID=$(az webapp show \
  --resource-group $RESOURCE_GROUP \
  --name $APP_SERVICE_NAME \
  --query "identity.principalId" \
  --output tsv)

# Assign users or groups
az ad app permission grant \
  --id $APP_ID \
  --api 00000003-0000-0000-c000-000000000000
Or via Azure Portal:
1. Entra ID → App registrations
2. Find your app ($APP_SERVICE_NAME)
3. Users and groups → Add user/group
4. Select operations team members
Scheduled scans: Cron vs Logic App
Option A: Cron inside container (simple)
Pros:
- Self-contained (everything in one container)
- No external dependencies
- Simple to maintain
Cons:
- Requires container restart to change schedule
- No external monitoring
- Logs only in container
When to use: Small teams, simple requirements, daily scans sufficient
Option B: Logic App webhook (enterprise)
Create webhook endpoint in App Service:
# Add webhook endpoint to scan script
cat > webhook.sh << 'EOF'
#!/bin/bash

# Simple HTTP server to receive webhook
while true; do
    echo "Waiting for webhook trigger..."
    nc -l -p 8081 -e /app/scan.sh
done
EOF

chmod +x webhook.sh
Logic App workflow:
{
  "definition": {
    "$schema": "https://schema.management.azure.com/providers/Microsoft.Logic/schemas/2016-06-01/workflowdefinition.json#",
    "actions": {
      "Trigger_AZQR_Scan": {
        "type": "Http",
        "inputs": {
          "method": "POST",
          "uri": "https://azqr-dashboard.azurewebsites.net/webhook",
          "authentication": {
            "type": "ManagedServiceIdentity"
          }
        }
      },
      "Wait_for_Completion": {
        "type": "Wait",
        "inputs": {
          "interval": {
            "count": 5,
            "unit": "Minute"
          }
        },
        "runAfter": {
          "Trigger_AZQR_Scan": ["Succeeded"]
        }
      },
      "Send_Teams_Notification": {
        "type": "Http",
        "inputs": {
          "method": "POST",
          "uri": "@parameters('TeamsWebhookUrl')",
          "body": {
            "text": "AZQR scan completed. View dashboard: https://azqr-dashboard.azurewebsites.net"
          }
        },
        "runAfter": {
          "Wait_for_Completion": ["Succeeded"]
        }
      }
    },
    "triggers": {
      "Recurrence": {
        "type": "Recurrence",
        "recurrence": {
          "frequency": "Day",
          "interval": 1,
          "schedule": {
            "hours": ["6"]
          }
        }
      }
    }
  }
}
Pros:
- External scheduling (change without container rebuild)
- Notifications (Teams, email)
- Advanced logic (scan on-demand, conditional scans)
- Azure Monitor integration
Cons:
- More complex architecture
- Additional Azure resource (Logic App cost)
- Requires webhook endpoint
When to use: Enterprise environments, complex workflows, notifications required
Accessing your dashboard
Dashboard URL:
https://azqr-dashboard.azurewebsites.net
First access:
1. Navigate to URL
2. Entra ID login prompt
3. Authenticate with corporate credentials
4. Dashboard loads
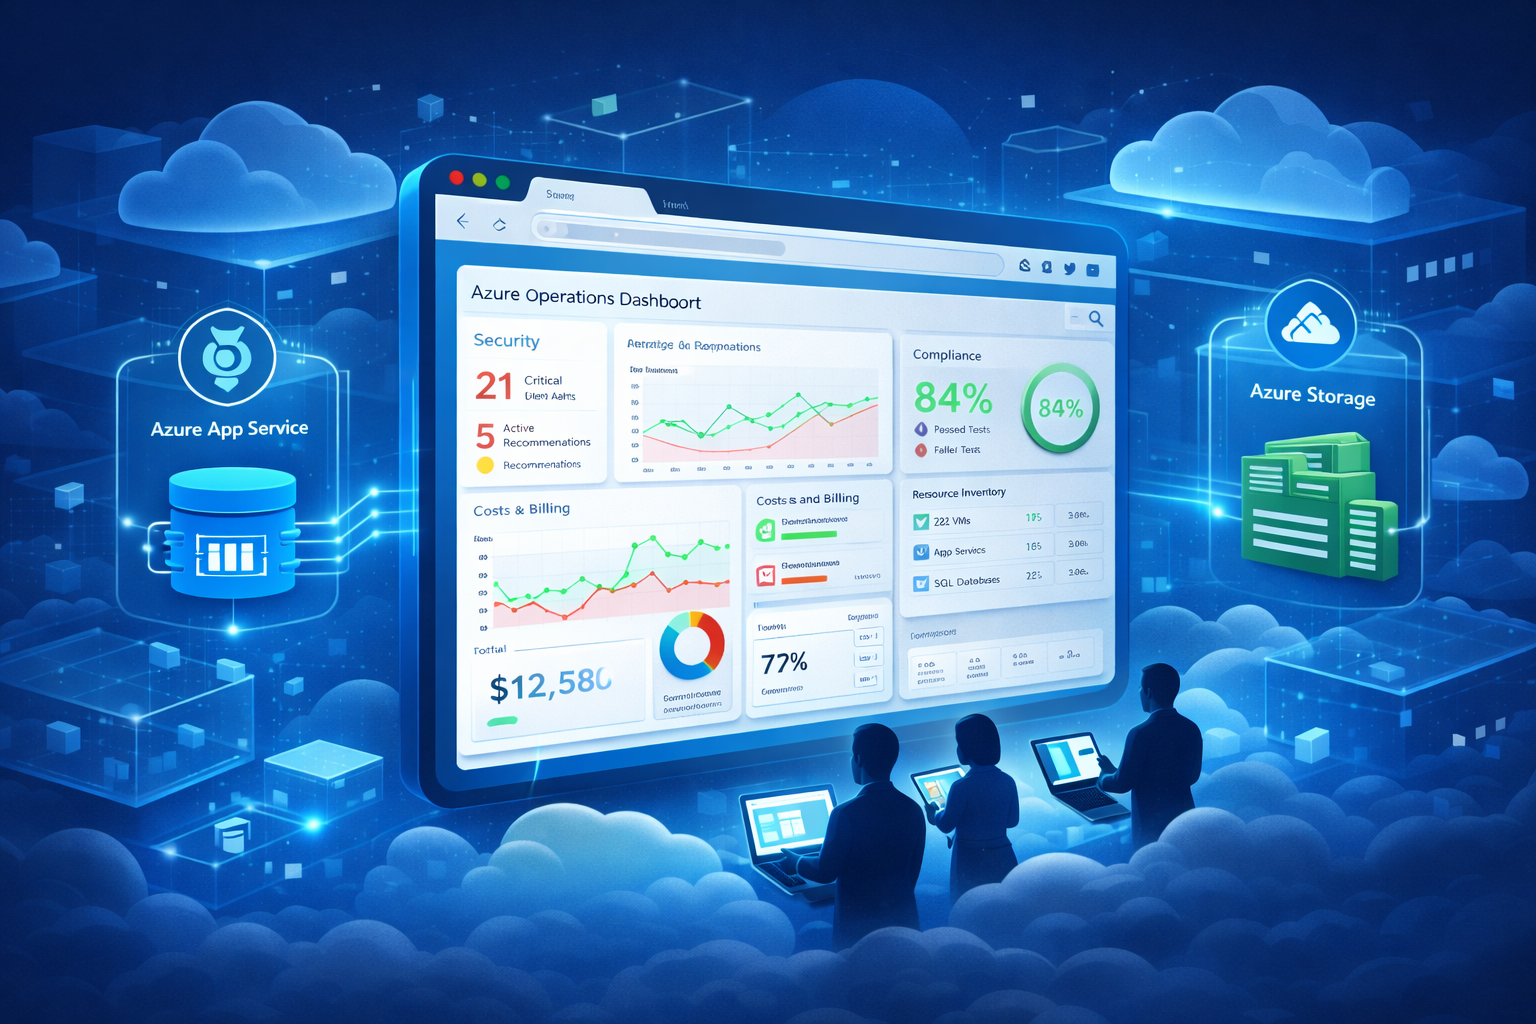
What you see:
Overview tab:
- Total resources scanned
- Recommendations by severity (Critical/High/Medium/Low)
- Compliance score
- Last scan timestamp
Best Practices tab (Azure Advisor):
- Reliability recommendations
- Security recommendations
- Cost optimization opportunities
- Performance improvements
- Operational excellence guidance
Security tab (Defender for Cloud):
- Active Defender plans
- Security recommendations
- Secure score
- Compliance standards (CIS, PCI-DSS, etc.)
Governance tab (Azure Policy):
- Policy assignments
- Non-compliant resources
- Policy definitions
- Exemptions
Cost Analysis tab:
- Spend by service
- Spend by resource group
- Cost trends
- Optimization recommendations
Inventory tab:
- All resources by type
- Resource groups
- Locations
- Tags (view your tag intelligence layer)
- Resource IDs
Historical tracking and analysis
Automated report retention:
Reports stored in Azure Storage: /reports/azqr-YYYY-MM-DD-HHMM.xlsx
# List all historical reports
az storage blob list \
  --account-name $STORAGE_ACCOUNT \
  --container-name reports \
  --output table

# Download specific report
az storage blob download \
  --account-name $STORAGE_ACCOUNT \
  --container-name reports \
  --name azqr-2025-12-01-0600.xlsx \
  --file ./azqr-december.xlsx
Retention policy:
Automated cleanup in scan script:
# Keep last 30 days
find "$REPORT_DIR" -name "azqr-*.xlsx" -mtime +30 -delete
Or configure blob lifecycle management:
az storage account management-policy create \
  --account-name $STORAGE_ACCOUNT \
  --policy '{
    "rules": [{
      "name": "DeleteOldReports",
      "enabled": true,
      "type": "Lifecycle",
      "definition": {
        "filters": {
          "blobTypes": ["blockBlob"],
          "prefixMatch": ["reports/azqr-"]
        },
        "actions": {
          "baseBlob": {
            "delete": {
              "daysAfterModificationGreaterThan": 365
            }
          }
        }
      }
    }]
  }'
Result: Keep 1 year of reports, automatic cleanup
Compare over time:
Download monthly snapshots:
# January 2025
az storage blob download \
  --account-name $STORAGE_ACCOUNT \
  --container-name reports \
  --name azqr-2025-01-01-0600.xlsx \
  --file ./jan-2025.xlsx

# February 2025
az storage blob download \
  --account-name $STORAGE_ACCOUNT \
  --container-name reports \
  --name azqr-2025-02-01-0600.xlsx \
  --file ./feb-2025.xlsx

# March 2025
az storage blob download \
  --account-name $STORAGE_ACCOUNT \
  --container-name reports \
  --name azqr-2025-03-01-0600.xlsx \
  --file ./mar-2025.xlsx
Analysis questions:
- Is security posture improving? (Defender recommendations decreasing?)
- Is policy compliance trending up? (Fewer non-compliant resources?)
- Is cost optimization working? (Underutilized resources being addressed?)
- Are Well-Architected Framework gaps closing? (Advisor recommendations resolved?)
How AZQR complements tags and Logic Apps
This is Part 3 of a three-layer platform.
Layer 1: Tags (Part 1)
What tags provide:
- Operational designation (Type: Server, Appliance, WSUS)
- Hybrid footprint tracking (OnPrem: Yes/No)
- Cost allocation (CostCenter, Application, Owner)
- Instant KQL queries (30-second answers)
Example:
// How many on-prem machines?
Resources
| where tags.OnPrem == "Yes"
| summarize count()
// Result: 847 machines (30 seconds)
Layer 2: Logic Apps (Part 2)
What Logic Apps provide:
- Certificate expiration monitoring
- Automated alerts (email, Teams, webhooks)
- Continuous monitoring (not monthly snapshots)
- Proactive problem detection
Example:
- Monitors 284 certificates across environment
- Alerts 30 days before expiration
- Catches Azure Migrate 18-month timer
Layer 3: AZQR Dashboard (this post)
What AZQR provides:
- Policy compliance scanning
- Security posture assessment
- Cost optimization recommendations
- Best practices validation
- Executive presentation layer
Example:
- Monthly compliance reports
- Historical tracking (trend analysis)
- Visual dashboard (non-technical stakeholders)
- Audit evidence (compliance requirements)
How they work together:
Daily operations:
- Tags + KQL: "How many servers in production?" → 30 seconds
- Logic Apps: Certificate expires in 25 days → automated alert
Weekly reviews:
- AZQR Dashboard: Review security recommendations
- Tags: Validate operational designations still accurate
- Logic Apps: Check automation health
Monthly compliance:
- AZQR: Generate formal report
- Tags: Cost allocation accuracy
- Logic Apps: Review automation coverage
Quarterly audits:
- AZQR: Historical trend analysis (12 months)
- Tags: Tag governance effectiveness
- Logic Apps: Automation ROI
What AZQR finds (real examples)
Security findings from our environment:
App Services without proper scaling:
Recommendation: Set minimum instance count to 2
Severity: Medium
Impact: Scalability
Resources Affected: 3 App Services
Remediation: Configure auto-scaling with min instances = 2
Storage accounts with shared key access:
Recommendation: Disable shared key access
Severity: High
Impact: Security
Resources Affected: 12 Storage Accounts
Remediation: Enforce Entra ID authentication only
Network Watchers missing tags:
Recommendation: Apply required tags
Severity: Low
Impact: Governance
Resources Affected: 2 Network Watchers
Remediation: Tag with Type, CostCenter, Owner
Cost findings:
Underutilized VMs:
Recommendation: Right-size VM from D4s_v3 to D2s_v3
Potential Savings: $150/month per VM
Resources Affected: 5 VMs
Action: Resize during maintenance window
Unattached disks:
Recommendation: Delete unattached managed disks
Potential Savings: $45/month
Resources Affected: 8 disks
Action: Verify no longer needed, then delete
Old snapshots:
Recommendation: Delete snapshots older than 90 days
Potential Savings: $80/month
Resources Affected: 23 snapshots
Action: Review retention policy, delete old snapshots
Well-Architected Framework gaps:
Front Door missing diagnostics:
Pillar: Operational Excellence
Recommendation: Enable diagnostic settings
Impact: Low
Action: Configure Log Analytics workspace
Front Door availability not configured:
Pillar: Reliability
Recommendation: Configure proper availability settings
Impact: High (SLA risk)
Action: Review Front Door configuration
What AZQR misses (and why you still need tags + Logic Apps)
AZQR is excellent for compliance scanning, but:
Certificate expiration (Logic App catches this):
AZQR doesn't monitor:
- Certificate expiration dates
- Azure Migrate 18-month certificate timer
- Key Vault certificate lifecycle
- App Service certificate renewal
Solution: Logic App certificate monitoring
Tag drift over time (KQL queries catch this):
AZQR shows tags in inventory, but doesn't detect:
- Type tag changed from Server to Appliance (why?)
- OnPrem tag still "Yes" but VM migrated 6 months ago
- CostCenter tag missing on new resources (policy bypass?)
Solution: KQL queries in tag intelligence post
// VMs in Azure still tagged OnPrem=Yes (drift)
Resources
| where type == "microsoft.compute/virtualmachines"
| where location contains "azure"
| where tags.OnPrem == "Yes"
| project name, location, resourceGroup
Vendor appliance patching status:
AZQR scans policy compliance, but doesn't know:
- Which Palo Alto firewalls need vendor updates
- Azure Migrate appliances approaching end of support
- Which appliances are vendor-managed vs self-managed
Solution: Type tag + Appliance/Vendor subtags (from tag intelligence)
Operational patterns:
AZQR provides snapshots, not continuous patterns:
- Cost anomalies (sudden 40% spend increase)
- Resource creation velocity (100 VMs created last night?)
- Failed deployments (5 attempts to create storage account?)
Solution: Logic Apps + Azure Monitor for continuous detection
Cost breakdown
Monthly costs:
App Service (B1 tier):
- $13.14/month (Linux, 1.75 GB RAM, 1 vCPU)
- Sufficient for AZQR dashboard
- Scales to B2/B3 if needed
Azure Storage:
- ~$2-5/month depending on report volume
- Blob storage: $0.0184/GB (LRS)
- 365 reports × 2 MB average = 730 MB = $0.01/month
- Operations: Minimal cost
Azure Container Registry (Basic):
- $5/month
- 10 GB storage included
Logic App (if using scheduled triggers):
- $0 (consumption plan)
- ~$0.01/month for daily triggers
Total: $15-25/month
Compare to:
- Third-party compliance tools: $500-2,000/month
- Manual compliance checking: 8 hours/week = 32 hours/month
- At $50/hour = $1,600/month in labor
ROI: Pays for itself in 1 day of manual work avoided.
Implementation roadmap
Week 1: Foundation
Day 1: Understand AZQR locally
- Install AZQR on laptop
- Run first scan
- Explore dashboard tabs
- Identify key metrics for your org
Day 2: Build container
- Create Dockerfile
- Test locally with Docker Desktop
- Verify scan.sh script works
- Test cron scheduling
Day 3: Deploy to Azure
- Create Azure resources (storage, ACR, App Service)
- Push container to ACR
- Deploy to App Service
- Verify dashboard accessible
Week 2: Authentication & Automation
Day 4: Enable authentication
- Configure Entra ID
- Test SSO login
- Assign user access
- Verify security
Day 5: Configure managed identity
- Enable system-assigned identity
- Grant Reader role at subscription
- Test automated scans
- Verify reports generating
Day 6: Storage integration
- Mount Azure Storage
- Verify reports persisting
- Configure retention policy
- Test historical access
Day 7: Scheduled scans
- Choose: Cron vs Logic App
- Configure schedule (daily 6 AM)
- Test automated execution
- Review logs
Week 3: Integration
Day 8-10: Connect to existing systems
- Cross-reference with tag intelligence
- Integrate with Logic App monitoring
- Add to operations runbook
- Train team on dashboard
Monitoring and maintenance
Health checks:
Daily automated checks:
# Check if dashboard is responding
curl -f https://azqr-dashboard.azurewebsites.net || echo "Dashboard down!"

# Check if latest report exists
az storage blob exists \
  --account-name $STORAGE_ACCOUNT \
  --container-name reports \
  --name azqr-latest.xlsx
View container logs:
# Stream logs
az webapp log tail \
  --resource-group $RESOURCE_GROUP \
  --name $APP_SERVICE_NAME

# Download logs
az webapp log download \
  --resource-group $RESOURCE_GROUP \
  --name $APP_SERVICE_NAME \
  --log-file logs.zip
Monitor scan execution:
# Check scan logs in storage
az storage blob download \
  --account-name $STORAGE_ACCOUNT \
  --container-name reports \
  --name logs/scan-2025-12-17-0600.log \
  --file ./latest-scan.log

# Review for errors
cat latest-scan.log | grep -i error
Common issues:
Dashboard not loading:
- Check App Service status: az webapp show --resource-group $RESOURCE_GROUP --name $APP_SERVICE_NAME
- Verify container running: Check container logs
- Test authentication: Disable auth temporarily to isolate issue
Scans failing:
- Verify managed identity has Reader role
- Check authentication: az login --identity in container
- Review scan logs for specific errors
Old dashboard data:
- Verify azqr-latest.xlsx updated: Check blob modified time
- Check cron running: Review cron logs in container
- Verify scan.sh copying report: Review scan logs
Production considerations
High availability:
For enterprise environments:
# Scale to Standard tier for staging slots
az appservice plan update \
  --resource-group $RESOURCE_GROUP \
  --name $APP_SERVICE_PLAN \
  --sku S1

# Create staging slot
az webapp deployment slot create \
  --resource-group $RESOURCE_GROUP \
  --name $APP_SERVICE_NAME \
  --slot staging

# Deploy to staging first
az webapp config container set \
  --resource-group $RESOURCE_GROUP \
  --name $APP_SERVICE_NAME \
  --slot staging \
  --docker-custom-image-name $CONTAINER_REGISTRY.azurecr.io/azqr-dashboard:v2

# Test staging
curl https://azqr-dashboard-staging.azurewebsites.net

# Swap to production (zero downtime)
az webapp deployment slot swap \
  --resource-group $RESOURCE_GROUP \
  --name $APP_SERVICE_NAME \
  --slot staging
Multi-subscription scanning:
Grant Reader across multiple subscriptions:
# Get managed identity
IDENTITY_ID=$(az webapp identity show \
  --resource-group $RESOURCE_GROUP \
  --name $APP_SERVICE_NAME \
  --query principalId \
  --output tsv)

# Grant Reader on multiple subscriptions
az role assignment create \
  --assignee $IDENTITY_ID \
  --role "Reader" \
  --scope "/subscriptions/subscription-id-1"

az role assignment create \
  --assignee $IDENTITY_ID \
  --role "Reader" \
  --scope "/subscriptions/subscription-id-2"

# AZQR will automatically scan all accessible subscriptions
Filtering specific resource groups:
YAML configuration (azqr-config.yaml):
subscriptions:
  - subscription-id-1
  - subscription-id-2

resourceGroups:
  - Production
  - Staging
  - Shared-Services

exclude:
  - Test-*
  - Dev-*

resourceTypes:
  - asp    # App Service Plans
  - sites  # Web Apps
  - vnet   # Virtual Networks
Update scan script to use config:
azqr scan --filters /app/azqr-config.yaml --output "$DATED_REPORT"
Next steps: Complete platform integration
You now have three operational layers:
- ✅ Tags - Data layer (operational intelligence)
- ✅ Logic Apps - Automation layer (continuous monitoring)
- ✅ AZQR Dashboard - Visualization layer (compliance reporting)
Part 4 (coming next): How these three layers work together as a unified operations platform.
Topics covered:
- Daily operational workflow
- Weekly review process
- Monthly compliance reporting
- Quarterly trend analysis
- Executive presentations
- Audit evidence generation
What you've built
Before:
- Six different Azure portals to check
- Manual compliance checking
- No historical tracking
- Hours of weekly work
After:
- One unified operations dashboard
- Always accessible at custom URL
- Automated daily scans
- 12 months of historical reports
- Team access with SSO
- Complete audit trail
Cost: $15-25/month
Setup time: 2-3 days
Ongoing maintenance: <1 hour/week
The Azure operations dashboard you've been looking for already exists. Microsoft built it. You just hosted it properly.
Compliance tools generate data. Dashboards create accountability.
Part 4 of this series shows how tags, Logic Apps, and this dashboard work together as a complete operations platform. Coming next.
Related posts in this series
Part 1: Azure Tags for Operational Intelligence
Part 2: Logic App Certificate Monitoring
Part 3: Building a Persistent AZQR Dashboard (you are here)
Part 4: Complete Platform Integration (coming soon)
Additional resources
AZQR documentation:
- Official repo: https://github.com/Azure/azqr
- Supported services: https://github.com/Azure/azqr#supported-services
- Rule definitions: azqr rules command
Azure documentation:
- App Service on Linux: https://learn.microsoft.com/azure/app-service/
- Managed identities: https://learn.microsoft.com/azure/active-directory/managed-identities-azure-resources/
- Azure Storage: https://learn.microsoft.com/azure/storage/
Related operational posts:
- Azure Update Manager Reality Check
- Azure Migrate 18-Month Limitation
Azure Admin Starter Kit (Free Download)
Get my KQL cheat sheet, 50 Windows + 50 Linux commands, and an Azure RACI template in one free bundle.
Get the Starter Kit →🚀 Azure Admin Starter Kit
Get the KQL cheat sheet, 50 Windows + 50 Linux commands, and Azure RACI template in one free bundle. Built from managing 44 subscriptions and 31,000+ resources.
Get the Starter Kit →Free download • No email required • Instant access