Azure FinOps Complete Guide 2026: Tag Governance, Cost Allocation & Chargeback Models
2026-01-03 · ~17 min read
Complete Azure FinOps implementation guide for enterprises: tag governance frameworks, departmental chargeback models, and cost allocation strategies. Includes ready-to-deploy templates and PowerShell automation.
⚡ Quick Answer: What is Azure FinOps?
Azure FinOps is the practice of bringing financial accountability to cloud spending through cross-functional collaboration between Finance, Engineering, and Operations teams. It answers three critical questions:
- Who owns this resource? (Tag governance)
- How much did each department spend? (Cost allocation)
- How do we bill it back? (Chargeback models)
💎 Skip the Trial-and-Error: Get the Complete FinOps Pack
Stop building tag governance frameworks from scratch. Get production-tested templates, PowerShell scripts, and chargeback calculators used to manage $2.4M annual Azure spend.
Tag schemas • Chargeback models • Budget alerts • PowerShell automation • Instant download
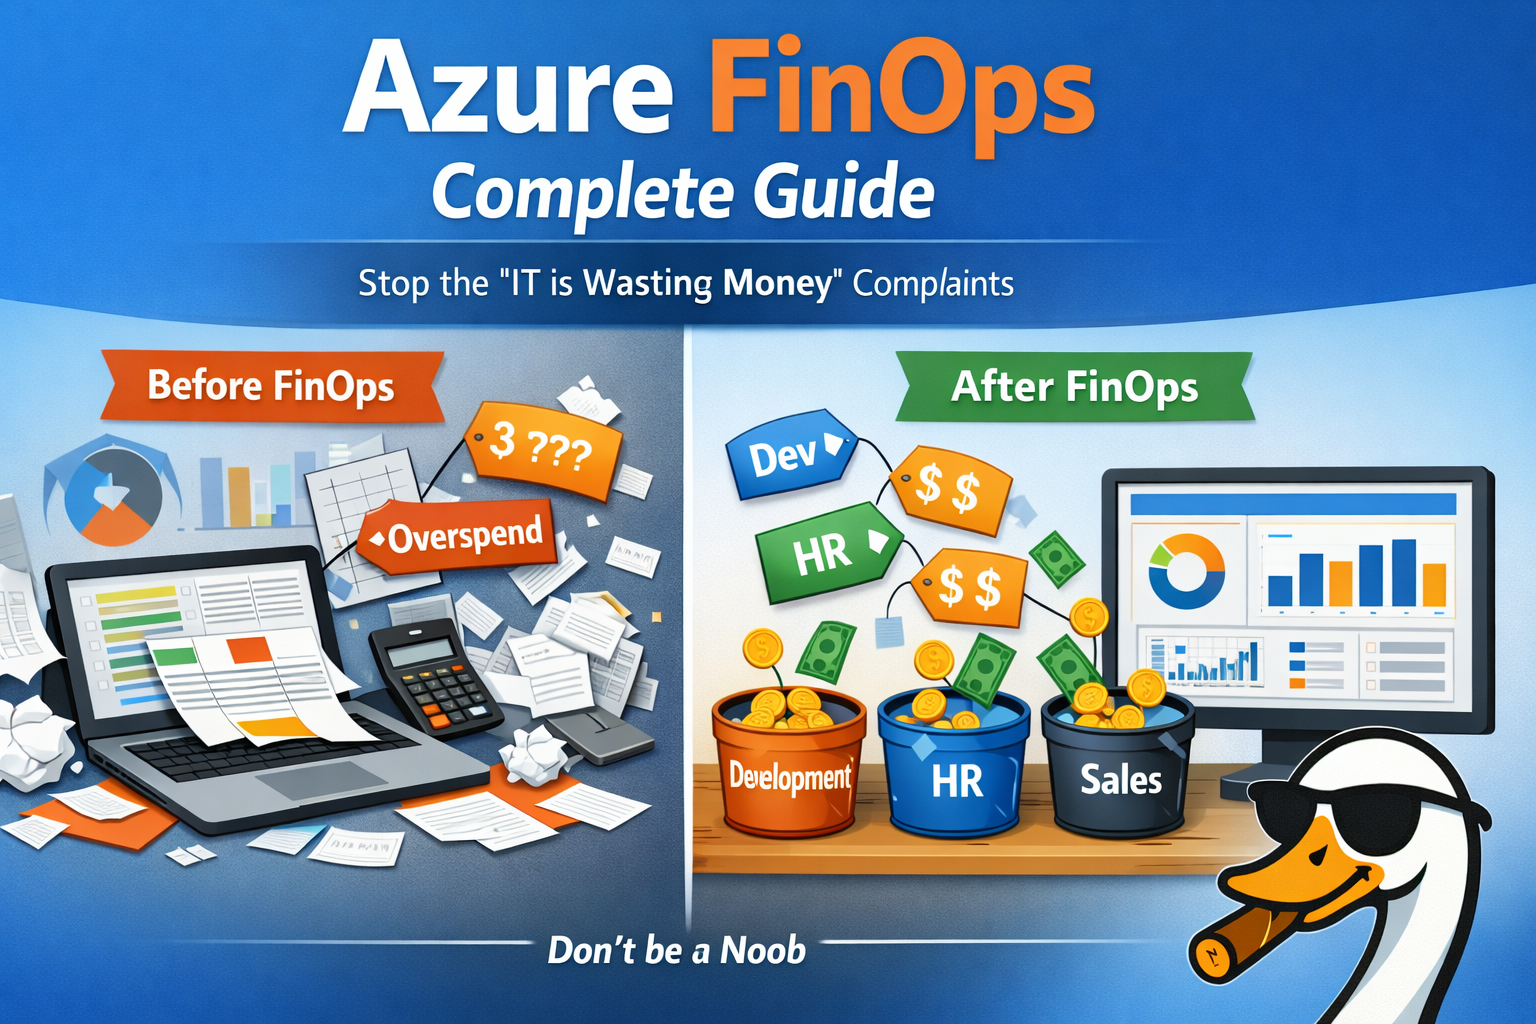
Why Azure FinOps Fails (And How to Fix It)
Most Azure FinOps implementations fail because organizations treat it as a Finance problem when it's actually an Engineering and Operations problem.
The failure pattern:
1. Finance demands cost reporting by department
2. IT creates a tagging policy
3. Nobody enforces the tags
4. 6 months later: 60% of resources are untagged
5. Finance gives up, goes back to spreadsheets
The solution: FinOps is a people problem with a technical implementation. You need:
- Clear ownership boundaries (RACI matrix)
- Automated tag enforcement (Azure Policy)
- Realistic chargeback models (not "perfect" allocation)
- Executive sponsorship (CFO + CTO alignment)
The Three Pillars of Azure FinOps
1. Tag Governance (Who Owns What)
The Problem:
In regulated environments like banking, subscriptions are security boundaries, not cost centers. You can't just create a "Marketing subscription" because PCI compliance requires network isolation.
The Solution:
Use tags to create virtual cost centers across security-segregated subscriptions.
Required Tags (Minimum):
CostCenter: "CC-12345"
Department: "Engineering"
Owner: "john.doe@company.com"
Environment: "Production"
Why These Four?
- CostCenter: Maps to finance systems (GL codes)
- Department: Human-readable for executives
- Owner: Someone to blame when costs spike
- Environment: Separate prod vs dev/test costs
Optional But Useful:
Project: "CustomerPortalRewrite"
ApplicationName: "CRMv2"
DataClassification: "Confidential"
ExpirationDate: "2026-06-30"
Tag Enforcement with Azure Policy:
{
  "mode": "Indexed",
  "policyRule": {
    "if": {
      "anyOf": [
        {
          "field": "tags['CostCenter']",
          "exists": "false"
        },
        {
          "field": "tags['Department']",
          "exists": "false"
        },
        {
          "field": "tags['Owner']",
          "exists": "false"
        }
      ]
    },
    "then": {
      "effect": "deny"
    }
  }
}
Reality Check: Start with append (adds tags) before using deny (blocks deployment). Otherwise, you'll break production deployments at 2 AM.
2. Cost Allocation (How Much Did We Spend)
The Challenge:
Azure Cost Management shows you total spend. But your CFO wants to know:
- How much did Marketing spend this month?
- What's the cost per customer for our SaaS product?
- Which projects are burning budget?
Subscription-Level Allocation (Easy Mode):
If you're lucky enough to have department-aligned subscriptions:
# Get monthly cost by subscription
$startDate = (Get-Date).AddMonths(-1).ToString("yyyy-MM-01")
$endDate = (Get-Date).ToString("yyyy-MM-dd")

Get-AzConsumptionUsageDetail -StartDate $startDate -EndDate $endDate |
  Group-Object SubscriptionName |
  Select-Object Name, @{N='Cost';E={($_.Group | Measure-Object -Property PretaxCost -Sum).Sum}} |
  Sort-Object Cost -Descending
Tag-Based Allocation (Hard Mode - Enterprise Reality):
When subscriptions are security boundaries, use tags:
// Cost by Department (last 30 days)
AzureConsumptionV3
| where TimeGenerated >= ago(30d)
| extend Department = tostring(tags["Department"])
| where isnotempty(Department)
| summarize TotalCost = sum(CostInBillingCurrency) by Department
| order by TotalCost desc
The Untagged Resource Problem:
You'll always have 10-30% untagged resources. Handle it one of two ways:
- Allocate to "IT Infrastructure" (honest but annoying for Finance)
- Distribute proportionally (fake precision but keeps CFO happy)
Example: Proportional Distribution
Marketing tagged spend: $10,000
Engineering tagged spend: $20,000
Untagged spend: $3,000

Marketing allocation: $10,000 + ($3,000 × 10/30) = $11,000
Engineering allocation: $20,000 + ($3,000 × 20/30) = $22,000
3. Chargeback Models (How Do We Bill It Back)
Three Approaches:
Showback (Awareness Only)
- Show departments their costs
- No actual budget transfers
- Best for: Organizations starting FinOps
Implementation:
- Monthly email with cost breakdown
- Power BI dashboard by department
- No financial consequences
Chargeback (Full Cost Recovery)
- IT bills departments for actual usage
- Budget transfers between cost centers
- Best for: Mature FinOps organizations
Implementation:
- Monthly invoice to department budgets
- Reconciliation with finance systems
- Dispute resolution process
Hybrid (Showback + Committed Chargeback)
- Base infrastructure = IT budget (showback)
- Project-specific resources = Department budget (chargeback)
- Best for: Most enterprises (this is what actually works)
Example Hybrid Model:
Shared Services (IT Budget):
- Azure AD Premium licenses: $50,000/year
- VPN Gateway: $876/month
- Log Analytics workspace: $1,200/month

Department Budgets (Chargeback):
- Marketing web app: $450/month → Marketing
- Sales CRM database: $2,100/month → Sales
- Engineering dev/test: $8,500/month → Engineering
Real-World Implementation: 90-Day Rollout
Month 1: Foundation
- Week 1: Define required tags (CostCenter, Department, Owner, Environment)
- Week 2: Deploy Azure Policy in Audit mode (log violations, don't block)
- Week 3: Tag existing resources using bulk operations
- Week 4: Switch Azure Policy to Append mode (auto-add tags)
Month 2: Reporting
- Week 5: Build Power BI dashboard (cost by department)
- Week 6: Create monthly showback emails
- Week 7: Set up budget alerts per cost center
- Week 8: First monthly FinOps review meeting (Finance + IT)
Month 3: Chargeback
- Week 9: Define chargeback policy (what gets charged back)
- Week 10: Build chargeback calculator (Excel or Power BI)
- Week 11: Dry run chargeback (show Finance, don't transfer yet)
- Week 12: Go live with chargeback (budget transfers start)
PowerShell Automation Scripts
Bulk Tag Resources by Subscription
# Tag all resources in a subscription with Department tag
$subscriptionId = "YOUR-SUBSCRIPTION-ID"
$departmentName = "Engineering"

Set-AzContext -SubscriptionId $subscriptionId

$resources = Get-AzResource

foreach ($resource in $resources) {
    $tags = $resource.Tags
    if ($null -eq $tags) {
        $tags = @{}
    }

    # Only add if Department tag doesn't exist
    if (-not $tags.ContainsKey("Department")) {
        $tags["Department"] = $departmentName
        Set-AzResource -ResourceId $resource.ResourceId -Tag $tags -Force
        Write-Host "Tagged: $($resource.Name)"
    }
}
Find Untagged Resources
# Find resources missing required tags
$requiredTags = @("CostCenter", "Department", "Owner")

Get-AzResource | ForEach-Object {
    $missingTags = @()
    foreach ($tag in $requiredTags) {
        if (-not $_.Tags.ContainsKey($tag)) {
            $missingTags += $tag
        }
    }

    if ($missingTags.Count -gt 0) {
        [PSCustomObject]@{
            ResourceName = $_.Name
            ResourceType = $_.ResourceType
            ResourceGroup = $_.ResourceGroupName
            MissingTags = $missingTags -join ", "
        }
    }
} | Format-Table -AutoSize
Monthly Cost Report by Department
# Generate CSV of costs by department for last month
$startDate = (Get-Date).AddMonths(-1).ToString("yyyy-MM-01")
$endDate = (Get-Date).AddDays(-1).ToString("yyyy-MM-dd")

$usage = Get-AzConsumptionUsageDetail -StartDate $startDate -EndDate $endDate

$usage |
    Where-Object { $_.Tags -and $_.Tags["Department"] } |
    Group-Object { $_.Tags["Department"] } |
    Select-Object @{N='Department';E={$_.Name}},
                  @{N='TotalCost';E={($_.Group | Measure-Object -Property PretaxCost -Sum).Sum}} |
    Export-Csv "AzureCosts_$(Get-Date -Format 'yyyy-MM').csv" -NoTypeInformation

Write-Host "Report saved to: AzureCosts_$(Get-Date -Format 'yyyy-MM').csv"
Common FinOps Mistakes (And How to Avoid Them)
Mistake #1: Perfect Tag Coverage Before Starting
Wrong: "We need 100% tag coverage before we can do chargeback"
Right: Start with 70% coverage, improve monthly
Why: You'll never hit 100%. Automated resources, Microsoft-managed services, and legacy deployments will always have gaps.
Mistake #2: Too Many Required Tags
Wrong: Requiring 12+ tags on every resource
Right: 4 required tags (CostCenter, Department, Owner, Environment)
Why: Every additional required tag increases deployment friction. Keep it simple.
Mistake #3: Tag Validation Without Lookup Tables
Wrong: Allowing free-text in Department tag
Right: Enforce values from approved list
Example Policy:
{
  "field": "tags['Department']",
  "in": ["Engineering", "Marketing", "Sales", "Finance", "IT", "Operations"]
}
Mistake #4: No Owner Accountability
Wrong: Department tags without individual owners
Right: Every resource has an Owner email address
Why: When costs spike, you need a specific person to contact, not a department.
Mistake #5: Monthly Cost Reviews Without Context
Wrong: "$45,000 Azure bill this month"
Right: "$45,000 Azure bill (+$8,000 vs last month). $5,000 increase from new prod deployment, $3,000 from SQL scaling"
Implementation: Track month-over-month changes by resource group or tag.
Azure FinOps Tools Comparison
| Tool | Best For | Cost | Complexity |
|---|---|---|---|
| Azure Cost Management | Basic reporting | Free | Low |
| Power BI | Custom dashboards | $10/user/mo | Medium |
| Azure FinOps Toolkit | Automated optimization | Free (OSS) | High |
| CloudHealth | Multi-cloud | $$$$ | High |
| Cloudability | FinOps maturity | $$$$ | High |
Recommendation for most orgs: Start with Azure Cost Management + Power BI. Only upgrade to enterprise tools if you're spending $500K+/month.
Metrics That Actually Matter
Don't measure:
- Total Azure spend (vanity metric)
- Number of resources (meaningless)
- Tag coverage percentage (gaming-prone)
Do measure:
- Cost per customer (unit economics)
- Unallocated spend percentage (tagging effectiveness)
- Budget variance by department (accountability)
- Time to resolve cost anomalies (operational efficiency)
- Savings from rightsizing recommendations implemented (optimization ROI)
The One-Page FinOps Runbook
Monthly Checklist:
- [ ] Export cost data from Azure Cost Management
- [ ] Allocate untagged costs (proportional or IT overhead)
- [ ] Generate department cost reports
- [ ] Email department managers their costs
- [ ] Review top 10 cost increases month-over-month
- [ ] Identify optimization opportunities (idle VMs, oversized SKUs)
- [ ] Update chargeback invoices for Finance
- [ ] FinOps review meeting (30 minutes, Finance + IT)
Quarterly Activities:
- [ ] Review and update tag taxonomy
- [ ] Audit tag compliance (fix drift)
- [ ] Revisit chargeback model (adjust as needed)
- [ ] Reserved Instance / Savings Plan analysis
- [ ] FinOps maturity self-assessment
Ready-to-Deploy Templates
Budget Alert (ARM Template)
{
  "$schema": "https://schema.management.azure.com/schemas/2019-04-01/deploymentTemplate.json#",
  "contentVersion": "1.0.0.0",
  "parameters": {
    "budgetName": {
      "type": "string",
      "defaultValue": "DepartmentBudget"
    },
    "amount": {
      "type": "int",
      "defaultValue": 10000
    },
    "emailAddress": {
      "type": "string"
    }
  },
  "resources": [
    {
      "type": "Microsoft.Consumption/budgets",
      "apiVersion": "2021-10-01",
      "name": "[parameters('budgetName')]",
      "properties": {
        "category": "Cost",
        "amount": "[parameters('amount')]",
        "timeGrain": "Monthly",
        "timePeriod": {
          "startDate": "[concat(utcNow('yyyy-MM'), '-01')]"
        },
        "notifications": {
          "Actual_GreaterThan_80_Percent": {
            "enabled": true,
            "operator": "GreaterThan",
            "threshold": 80,
            "contactEmails": [
              "[parameters('emailAddress')]"
            ]
          }
        }
      }
    }
  ]
}
Cost Allocation Excel Formula
// In Excel: Department allocation with proportional untagged distribution

=IF(ISBLANK([@[Tagged_Cost]]),
    0,
    [@[Tagged_Cost]] +
    ([@[Tagged_Cost]] / $B$20 * $B$21)
)

Where:
- Tagged_Cost = Column with department's direct costs
- B20 = Total tagged costs across all departments
- B21 = Total untagged costs to distribute
What Happens After FinOps Implementation
Month 1-3: Chaos
- Developers complain about tag requirements
- Finance complains about data quality
- Executives ask why costs went up (visibility != reduction)
Month 4-6: Stabilization
- Tag compliance reaches 70-80%
- Monthly reports become routine
- First round of optimization (kill idle VMs)
Month 7-12: Value
- Cost-conscious culture emerges
- Departments self-optimize
- FinOps becomes boring (which means it's working)
The Real Win: Not cost reduction, but cost predictability. CFOs can budget accurately. Departments can plan capacity. Finance and IT stop fighting.
🎯 Skip 90 Days of Trial-and-Error
The Azure FinOps Implementation Pack includes everything in this guide, plus:
- ✅ Tag Governance Framework - Enforce cost center, department, owner tags via Azure Policy
- ✅ Chargeback Calculator - Department-level cost allocation in Excel with formulas
- ✅ Budget Alert Templates - ARM templates for Azure Monitor cost spike alerts
- ✅ Subscription Tagging Strategy - Handle security boundaries that aren't cost centers
- ✅ PowerShell Scripts - Automate tag enforcement, reporting, and remediation
- ✅ 90-Day Rollout Plan - Week-by-week implementation checklist
💯 Full refund if it doesn't solve your tag governance headache
FAQ: Azure FinOps
Q: Do I need FinOps if I only have 5 subscriptions?
A: Yes, if you have multiple departments sharing costs. FinOps scales down - even a simple showback email prevents "IT is wasting money" complaints.
Q: Should subscriptions be cost centers or security boundaries?
A: In regulated industries (banking, healthcare, government): Security boundaries. Use tags for cost allocation. In startups/SaaS: Cost centers are fine.
Q: How do I handle shared services like VPN Gateway?
A: Two options: (1) Allocate to IT overhead, (2) Distribute proportionally by department usage. Option 1 is simpler and more honest.
Q: What's the ROI of FinOps?
A: Not cost reduction (common misconception). The ROI is cost predictability and reduced Finance-IT friction. Typical savings: 10-15% from killing waste, but the real value is operational efficiency.
Q: How long does FinOps implementation take?
A: 90 days to basic chargeback. 6-12 months to mature FinOps culture. Never "done" - it's continuous improvement.
Q: Can I do FinOps without Azure Policy?
A: Technically yes, but you'll fail. Manual tag compliance doesn't scale past 50 resources. Azure Policy enforcement is non-negotiable.
Next Steps
If you're just starting:
1. Define your 4 required tags (CostCenter, Department, Owner, Environment)
2. Deploy Azure Policy in Audit mode
3. Tag your top 20 most expensive resources manually
4. Generate your first monthly cost report by department
If you're already doing FinOps:
1. Calculate your untagged resource percentage
2. Review your chargeback model (is it actually being used?)
3. Add budget alerts for top 5 cost centers
4. Schedule recurring monthly FinOps review meeting
If you want to skip the learning curve:
- Get the FinOps Implementation Pack ($47) - Templates, scripts, and ready-to-deploy policies
This guide is based on managing $2.4M annual Azure spend across 44 subscriptions in a Fortune 500 bank. FinOps isn't theory - it's what actually works in regulated, enterprise environments.
Azure Admin Starter Kit (Free Download)
Get my KQL cheat sheet, 50 Windows + 50 Linux commands, and an Azure RACI template in one free bundle.
Get the Starter Kit →💰 Stop Guessing at Azure Costs
Get the Azure FinOps Framework with cost allocation templates, tag governance policies, and showback dashboards that finance actually understands.
Download FinOps FrameworkExcel template • KQL queries included • No email required