The KQL Problem Nobody Warns You About: You're Learning One Language Across Five Different Systems
2025-10-24 · ~19 min read
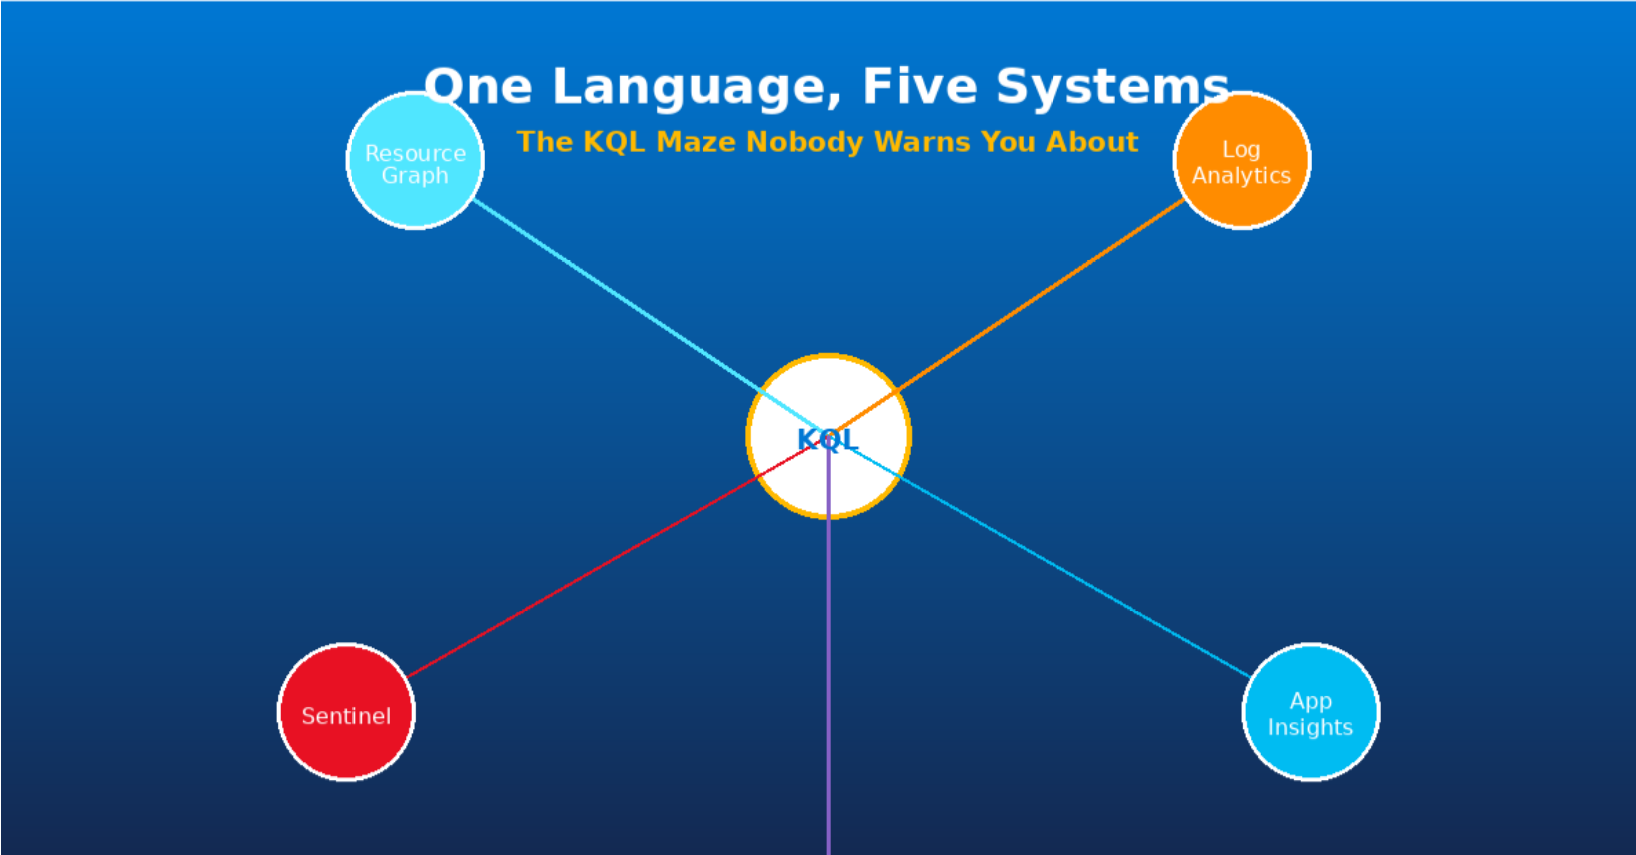
Everyone learns KQL in Log Analytics. Nobody warns you about Resource Graph, Sentinel, App Insights, or Defender. Here's the decision framework you need before you build the wrong thing in the wrong place.
You learned KQL from Microsoft Learn. You wrote your first queries in Log Analytics. They worked. You kept writing more.
Three months later, your queries are timing out. Six months later, you're staring at a $10,000 monthly Log Analytics bill. One year later, you discover Azure Resource Graph exists and realize you've been building everything in the wrong place.
Here's what nobody told you: KQL isn't one system. It's one language across five completely different systems, and Microsoft's documentation never explains which one to use when.
This is that explanation.
The Walk-Right-By Problem
Microsoft Learn teaches KQL in the Log Analytics context. The Azure Portal defaults to Log Analytics for everything. Example queries are Log Analytics focused. Most blog posts assume you already know about the other systems.
So you learn KQL, write queries in Log Analytics because that's what you learned, and walk right past four other systems that might be better for your actual use case.
The progression looks like this:
Month 1: Learn KQL syntax, write sample queries
Month 2: Build VM inventory queries in Log Analytics
Month 3: Queries start timing out, results take 30+ seconds
Month 4: See first shocking bill, start optimizing queries
Month 6: Can't correlate data across 10 different workspaces
Month 12: Finally discover Resource Graph exists
Month 18: Realize half your queries are in the wrong system, start migration
The hidden cost:
You're paying for Log Analytics ingestion you don't need. You're running slow queries that could be instant. You created multiple workspaces when you needed one system. You built technical debt that requires rework.
And nobody warned you any of this would happen.
The Five KQL Systems
Same language. Completely different purposes. Here's what each one actually does.
System 1: Azure Resource Graph
What it is:
A real-time inventory database for Azure resources. It mirrors Azure Resource Manager (ARM) state and answers "what exists right now" questions. It's free, included with your Azure subscription, and queries complete in under a second.
What it's not:
Not for logs. Not for metrics. Not for security events. Not for application telemetry. No retention window because it only shows current state.
When to use it:
- VM inventory across all subscriptions
- Resource tagging compliance reports
- Network topology mapping (VNets, subnets, NSGs)
- Cost allocation foundations
- "Show me all resources of type X in any subscription"
Example query:
Resources
| where type == "microsoft.compute/virtualmachines"
| extend vmSize = properties.hardwareProfile.vmSize
| extend osType = properties.storageProfile.osDisk.osType
| project name, resourceGroup, location, vmSize, osType, subscriptionId
| order by name asc
This runs across every subscription you have access to. Instantly. Free.
The classic mistake:
Running this inventory query in Log Analytics instead. You're paying for 30-90 days of retention on data that Resource Graph gives you for free and faster. I've seen organizations spend thousands per month ingesting VM inventory data into Log Analytics when Resource Graph would have been free.
System 2: Log Analytics Workspaces
What it is:
Time-series log storage and analytics with an ingestion cost model. You pay per GB ingested plus retention. It's built for troubleshooting and historical analysis, requires agents or diagnostic settings to send data, and multiple workspaces create data silos.
What it's not:
Not free. Not real-time inventory. Not automatically populated.
When to use it:
- Performance troubleshooting (VM had high CPU 3 days ago, why?)
- Application log analysis
- Windows Event Log queries
- Capacity planning with historical metrics
- Compliance audit trails
- "What happened at 2 AM last Tuesday?"
Example query:
Perf
| where TimeGenerated > ago(7d)
| where ObjectName == "Processor" and CounterName == "% Processor Time"
| where InstanceName == "_Total"
| summarize AvgCPU = avg(CounterValue) by Computer, bin(TimeGenerated, 1h)
| where AvgCPU > 80
| order by TimeGenerated desc
This query needs historical performance data. Resource Graph can't answer it. Log Analytics is the right tool.
Classic mistakes:
Creating 10+ workspaces because you created one per subscription or one per team. Now you can't query across them easily.
Ingesting data you never query. You're paying for storage you don't use.
Using Log Analytics for inventory questions when Resource Graph is free and faster.
Not setting retention policies appropriately. Paying for 2 years of data when you only need 30 days.
System 3: Microsoft Sentinel
What it is:
A SIEM (Security Information and Event Management system) built on top of Log Analytics. It correlates security events and detects threats. Costs include both Log Analytics ingestion and Sentinel licensing.
What it's not:
Not required for basic Azure monitoring. Not for general-purpose log analysis. Not cheaper than Log Analytics (it's Log Analytics plus additional costs).
When to use it:
- Security incident investigations
- Threat hunting across multiple data sources
- Automated response to security events
- Compliance reporting (SOC 2, PCI-DSS)
- Correlating Azure logs with firewall, Active Directory, and Office 365 security events
Example query:
SecurityEvent
| where TimeGenerated > ago(24h)
| where EventID == 4625 // Failed logon attempts
| summarize FailedLogons = count() by Account, Computer
| where FailedLogons > 10
| order by FailedLogons desc
This hunts for brute force attacks across your environment. Sentinel is built for this.
The classic mistake:
Enabling Sentinel because it's "recommended" without understanding you're adding 20-30% cost on top of Log Analytics. If you don't have a security operations center or compliance requirements, you probably don't need it yet.
System 4: Application Insights
What it is:
Application performance monitoring (APM) for code. It captures telemetry like exceptions, requests, dependencies, and custom events. Built on Log Analytics but with application-specific schemas.
What it's not:
Not for infrastructure monitoring. Not for Azure resource inventory. Not automatically populated (requires SDK/instrumentation in your code).
When to use it:
- Application performance troubleshooting
- Exception tracking and debugging
- User session analysis
- API dependency mapping
- "Why is my web app slow?"
Example query:
requests
| where timestamp > ago(1h)
| where success == false
| summarize FailedRequests = count() by operation_Name, resultCode
| order by FailedRequests desc
This shows which API endpoints are failing. Application Insights is the only system with this data.
The classic mistake:
Trying to query Application Insights data with Resource Graph queries or vice versa. They use the same language but completely different data models. A Resource Graph query won't return application telemetry.
System 5: Microsoft Defender / Microsoft 365 Defender / Purview
What it is:
Security-focused KQL for endpoint protection, email security, identity threats, and data loss prevention. Separate portal, separate data model, built for security analysts.
What it's not:
Not for Azure infrastructure monitoring. Not for application logs. Not integrated with Resource Graph or Log Analytics.
When to use it:
- Endpoint threat hunting (compromised laptops)
- Email security investigations (phishing campaigns)
- Identity risk analysis (unusual sign-ins)
- Data loss prevention queries (Purview)
- "Which endpoints have this vulnerability?"
Example query:
DeviceProcessEvents
| where Timestamp > ago(7d)
| where ProcessCommandLine contains "powershell"
| where ProcessCommandLine contains "-encodedcommand"
| project Timestamp, DeviceName, AccountName, ProcessCommandLine
| order by Timestamp desc
This hunts for obfuscated PowerShell commands that might indicate malware. Defender for Endpoint is the only system with this data.
The classic mistake:
Assuming Defender queries work in Log Analytics. Same language, completely different system with different tables and schemas.
The Decision Framework
Here's how to choose the right system every time.
Question 1: What Are You Actually Trying to Do?
"I need to know what EXISTS right now"
→ Azure Resource Graph
Examples: VM inventory, missing tags, network topology, cost allocation queries, compliance checks
"I need to know what HAPPENED (historical data)"
→ Log Analytics
Examples: VM was slow yesterday, who accessed this file last week, application errors on Tuesday, 90-day CPU trends, audit trail for deleted resource
"I need to HUNT THREATS or investigate security incidents"
→ Sentinel (Azure/infrastructure) or Defender (endpoints/Office 365)
Examples: Unusual sign-ins, lateral movement, data exfiltration attempts, phishing campaigns, malware spreading
"I need to troubleshoot APPLICATION CODE performance"
→ Application Insights
Examples: Slow API endpoint, database query timeouts, exception spikes, user session flows, dependency mapping
Question 2: How Much Are You Willing to Pay?
Free (included with Azure):
- Azure Resource Graph: Unlimited queries, no ingestion costs
Pay-per-GB ingested:
- Log Analytics: ~$2.30/GB ingested + retention costs
- Application Insights: ~$2.30/GB ingested + retention costs
- Sentinel: Log Analytics costs + $2.00/GB Sentinel licensing
Decision tree:
If the data already exists in ARM state → Use Resource Graph (free)
If you need historical logs → Accept Log Analytics costs but tune retention carefully
If you need security correlation → Budget for Sentinel properly, it's not cheap
If you need app telemetry → Instrument carefully, Application Insights costs add up fast
Question 3: How Many Workspaces Do You Actually Need?
The workspace sprawl problem:
Most organizations accidentally create:
- One workspace per subscription (can't query across them)
- One workspace per environment (dev, test, prod all separated)
- One workspace per team (siloed data)
Result: 10-30 workspaces, impossible to correlate data, operational nightmare.
Better approach:
Start with ONE Log Analytics workspace for your entire organization. Only create additional workspaces for genuine isolation needs:
- Regulatory requirements (PCI data must be isolated)
- Cost allocation by business unit for chargeback
- Data residency requirements (EU data must stay in EU region)
- Security boundaries (HR data separate from general IT)
Resource Graph advantage:
Automatically queries across ALL subscriptions. No workspace sprawl problem.
Practical Tools and Workflows
Tool 1: VSCode + Kusto Extension
Stop writing queries in the Azure Portal. Use VSCode.
Setup:
- Install "Kusto" extension in VSCode
- Configure connections for each system:
- Resource Graph:
https://management.azure.com - Log Analytics: Your workspace ID
- Sentinel: Workspace ID with Sentinel connection
- App Insights: Your application ID
Workflow benefits:
- Write queries once, save in Git for version control
- Syntax highlighting and IntelliSense for each system
- Export results to CSV/JSON
- No switching between Portal tabs
- Share queries with team through Git repo
Example VSCode workspace structure:
/queries
  /resource-graph
    vm-inventory.kql
    network-topology.kql
    tag-compliance.kql
  /log-analytics
    performance-troubleshooting.kql
    audit-queries.kql
    capacity-planning.kql
  /sentinel
    threat-hunting.kql
    failed-logon-analysis.kql
  /app-insights
    api-performance.kql
    exception-tracking.kql
Tool 2: PowerShell Automation
Resource Graph queries at scale:
# Query across ALL subscriptions automatically
$query = @"
Resources
| where type == 'microsoft.compute/virtualmachines'
| extend vmSize = properties.hardwareProfile.vmSize
| project name, resourceGroup, location, vmSize, subscriptionId
"@

$results = Search-AzGraph -Query $query

# Export to CSV for reporting
$results | Export-Csv -Path "vm-inventory.csv" -NoTypeInformation
Log Analytics queries:
# Query specific workspace
$workspaceId = "your-workspace-id"

$query = @"
Perf
| where TimeGenerated > ago(1h)
| where CounterName == "% Processor Time"
| summarize AvgCPU = avg(CounterValue) by Computer
| where AvgCPU > 80
"@

$results = Invoke-AzOperationalInsightsQuery -WorkspaceId $workspaceId -Query $query

# Process results
$results.Results | Format-Table
When to automate:
- Daily inventory reports → Resource Graph + scheduled PowerShell
- Weekly cost allocation → Resource Graph + export to Excel
- Security compliance checks → Sentinel + automated alerts
- Performance baselines → Log Analytics + trend analysis
Tool 3: Azure Resource Graph Explorer
When to use the Portal:
- Quick inventory checks during incident response
- Ad-hoc queries (one-time questions)
- Learning KQL on a free system before paying for Log Analytics
When NOT to use the Portal:
- Production reporting (no version control, no repeatability)
- Scheduled queries (use PowerShell instead)
- Complex queries with 50+ lines (use VSCode for better editing)
The Cost Optimization Play
Let's fix the damage.
Audit: What Are You Paying For?
Run this Resource Graph query to find all your Log Analytics workspaces:
Resources
| where type == "microsoft.operationalinsights/workspaces"
| extend dailyQuotaGB = properties.dailyQuotaGb
| extend retentionDays = properties.retentionInDays
| extend sku = properties.sku.name
| project name, resourceGroup, location, dailyQuotaGB, retentionDays, sku, subscriptionId
| order by name asc
Questions to ask:
- How many workspaces do we have? (Should be 1-3, not 10+)
- What's our total daily ingestion? (Should match actual needs, not uncapped)
- What's our retention policy? (90 days default, but do you need it?)
- Are we ingesting data we never query? (Check query patterns in Portal)
Check your Log Analytics costs:
Go to Azure Portal → Cost Management → Cost Analysis
Filter by Service: Log Analytics
Group by Resource
Sort by cost descending
Now you know what's expensive.
Migration: Move Queries to the Right System
Step 1: Identify inventory queries in Log Analytics
Look for queries that don't filter by TimeGenerated. These are probably inventory queries that should be in Resource Graph.
// This is in the WRONG system (Log Analytics)
Heartbeat
| distinct Computer, OSType, ComputerIP, SubscriptionId
Step 2: Rewrite for Resource Graph
// This is in the RIGHT system (Resource Graph - free!)
Resources
| where type == "microsoft.compute/virtualmachines"
| extend vmId = tolower(id)
| extend osType = properties.storageProfile.osDisk.osType
| extend vmSize = properties.hardwareProfile.vmSize
| project vmId, name, location, resourceGroup, osType, vmSize, subscriptionId
| order by name asc
Savings:
- Eliminate Log Analytics ingestion for VM inventory data
- Reduce to free Resource Graph queries
- Faster results (sub-second vs 30+ seconds)
- Spans all subscriptions automatically
Common candidates for migration:
- VM inventory queries
- Network topology queries (VNets, subnets, NSGs)
- Resource tagging reports
- Cost allocation queries (resources by subscription/resource group)
- Compliance checks (encryption enabled? public IPs exposed?)
Retention Tuning: Stop Paying for Old Data
Default retention: 90 days
What most organizations actually need:
- Performance data: 30 days (troubleshoot recent issues)
- Security logs: 90-365 days (compliance requirements)
- Application logs: 30 days (debug recent releases)
- Audit logs: 365+ days (regulatory requirements)
How to tune retention per table:
# Set 30-day retention for Perf table
Set-AzOperationalInsightsTable `
    -ResourceGroupName "your-rg" `
    -WorkspaceName "your-workspace" `
    -TableName "Perf" `
    -RetentionInDays 30

# Set 365-day retention for security audit logs
Set-AzOperationalInsightsTable `
    -ResourceGroupName "your-rg" `
    -WorkspaceName "your-workspace" `
    -TableName "AzureActivity" `
    -RetentionInDays 365
Archive strategy:
For compliance data that must be kept for years but is rarely queried:
- Keep 30-90 days in Log Analytics (fast queries)
- Archive older data to Azure Data Explorer or blob storage (cheap storage, slower queries)
- Query archived data only when needed for audits/investigations
Your Action Plan (Start Monday)
Week 1: Audit Current State
Monday morning checklist:
- Run the Resource Graph query above to count your workspaces
- Check daily ingestion rates in Azure Portal → Monitor → Log Analytics
- Review your top 10 most-queried tables (Usage and Estimated Costs blade)
- Identify inventory queries (candidates for Resource Graph migration)
Deliverable:
Create a spreadsheet with:
| Workspace Name | Daily Ingestion (GB) | Retention (Days) | Monthly Cost | Migration Candidates |
|---|---|---|---|---|
| prod-workspace | 50 GB | 90 | $3,450 | VM inventory, tag reports |
| dev-workspace | 10 GB | 90 | $690 | Network topology |
Week 2: Start Migration
Priority 1: Move inventory queries to Resource Graph
Migrate these first:
- VM inventory
- Tag compliance reports
- Network topology queries
- Cost allocation foundations
Process:
- Copy existing Log Analytics query
- Rewrite for Resource Graph schema (Resources table)
- Test in Resource Graph Explorer
- Save in Git repo (VSCode workspace)
- Update documentation and dashboards
Expected outcome:
- 10-20% reduction in Log Analytics ingestion
- Faster query performance (instant vs 30 seconds)
- Single pane across all subscriptions
Week 3: Consolidate Workspaces (If Needed)
Only do this if you have 5+ workspaces with no regulatory justification
Process:
- Document current workspace usage (what data, who queries it)
- Identify genuine isolation requirements (regulatory, security, residency)
- Plan consolidation target: 1-3 workspaces maximum
- Migrate agents and diagnostic settings to new workspace
- Update queries and dashboards with new workspace IDs
- Decommission old workspaces after validation period
Warning:
Workspace consolidation is disruptive. Only do this if sprawl is causing real problems: can't correlate data, excessive costs, operational complexity.
Week 4: Set Up Proper Tooling
VSCode workspace for queries:
- Install Kusto extension in VSCode
- Create folder structure (resource-graph/, log-analytics/, sentinel/, etc.)
- Migrate your top 10 queries from Portal to VSCode
- Commit to Git repo (queries now version controlled)
- Share with team
PowerShell automation:
- Automate daily VM inventory report using Resource Graph
- Schedule weekly cost allocation exports
- Create alert for unexpected Log Analytics ingestion spikes
- Document automation in team wiki
The Three Rules to Never Forget
Rule 1: If It Exists Right Now, Use Resource Graph
Not Log Analytics.
Resource Graph is free, fast, and automatically spans all subscriptions.
Exceptions:
- You need historical data (what existed 3 days ago)
- You need performance metrics (Log Analytics has Perf table)
Rule 2: Every GB Ingested Into Log Analytics Costs You
Don't ingest data "just in case."
Before enabling a new data source, ask:
- What questions will this answer?
- How often will we query it?
- Can we answer this with Resource Graph instead?
- What's the retention requirement?
If you don't have answers, don't enable it.
Rule 3: One Workspace Per Organization Unless You Have a Damn Good Reason
Workspace sprawl is the enemy of correlation.
Valid reasons for multiple workspaces:
- ✅ Regulatory isolation (PCI, HIPAA requirements)
- ✅ Data residency (EU data must stay in EU region)
- ✅ Cost allocation with formal chargeback model
- ✅ Security boundaries (HR data separate from IT operations)
Invalid reasons:
- ❌ "One workspace per subscription" (Resource Graph spans subscriptions)
- ❌ "One workspace per team" (use RBAC instead)
- ❌ "One workspace per environment" (use tags to separate dev/prod data)
Conclusion: The Guide Microsoft Didn't Give You
Five systems. Same language. Completely different purposes.
You learned KQL syntax. Nobody explained there were five different places to use it.
Now you know:
- Which system to use when (decision framework)
- How to stop wasting money (cost optimization)
- Where to write your queries (VSCode, not Portal)
- How to avoid workspace sprawl (one workspace unless you can't)
The next time someone says "Just learn KQL":
Ask them: "Which KQL system? Because there are five."
Then send them this article.
Quick Reference Table
| Question Type | System | Cost | Speed | Scope |
|---|---|---|---|---|
| What exists right now? | Resource Graph | Free | Sub-second | All subscriptions |
| What happened last week? | Log Analytics | $2.30/GB | 5-30 seconds | Per workspace |
| Security incident? | Sentinel | LA + $2/GB | 10-60 seconds | Per workspace |
| App performance? | App Insights | $2.30/GB | 5-30 seconds | Per app |
| Endpoint threat? | Defender | Included | 5-30 seconds | Per tenant |
Further Reading
Official Microsoft Documentation:
- Azure Resource Graph documentation (finally, the thing you should have learned first)
- Log Analytics retention and costs (prepare for sticker shock)
- Sentinel pricing calculator (spoiler: it's expensive)
Tools:
- VSCode Kusto extension (where you should actually write queries)
- Azure Resource Graph sample queries on GitHub (working examples)
Community Resources:
- KQL cheat sheet (syntax reference)
- Resource Graph query examples (real-world patterns)
This post is part of the Azure Noob series. If this helped you avoid the $10k mistake, consider sharing it with your team.